Collecting Data and Using it in a Spreadsheet


Eisenhower Middle School

Wyckoff, New Jersey


Mr. Bonavitacola Mr. DeBlock
Mr. Olejarz


Data Analysis and Presentation


Click Here To Login To Eisenhower Google Apps


Click here to learn more about Google Apps


Collecting Data and Using it in a Spreadsheet


1. Olympic Data Project


Use the link below to create a spreadsheet based on Olympic statistics.


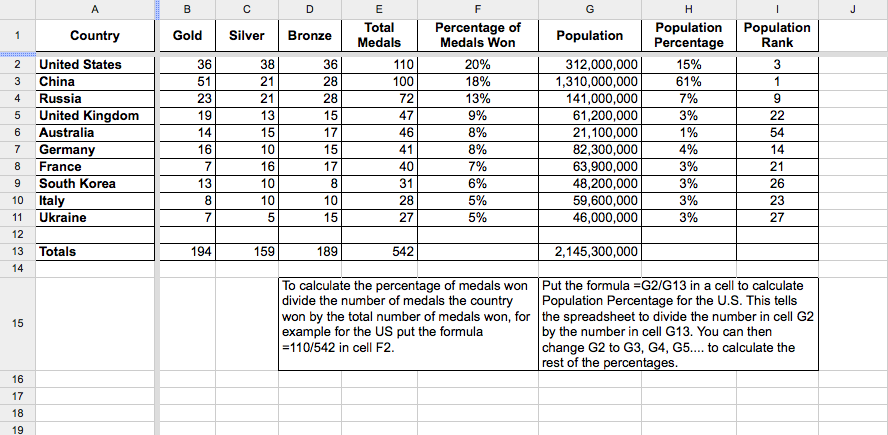
Use this link for data that can be pasted into a Google Spreadsheet (use Command-C to copy and Command-V to paste the data into your Google spreadsheet) http://www.databaseolympics.com/


This search engine http://www.wolframalpha.com can find the population of a country for any year just enter population, country, year, so for the population of  France in 1920 type population France 1920 into the search box. To see an example of what your spreadsheet should look like click here.


Olympic Data Checklist - Data Analysis and Presentation


Olympic Data Checklist.pdf


Formulas and Formatting (5 points each = total 50 points)

  1. Header is filled in (Title and Name)
  2. Bold Column/Row headings
  3. Column Widths adjusted or Text Wrapped
  4. Total Medals calculated
  5. Average medals calculated
  6. Maximum medals calculated
  7. Minimum medals Calculated
  8. Decimals adjusted to whole numbers
  9. A grid is applied to the entire table
  10.  The text is centered in all of the cells


Sorting  (10 points each = Total 30 points)

  1. Sort alphabetically by country name
  2. Sort by year with the most gold medals (high to low)
  3. Sort by year with the highest total medals (high to low)


Graph (5 points each = 20 Points)

  1. Title
  2. X axis Labeled
  3. Y axis labeled
  4. Scale adjusted if necessary